A Comparative Study of Mipmapping Techniques for Interactive Volume Visualization
Journal of WSCG 2016
Abstract
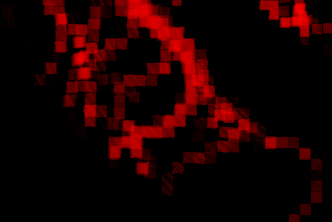
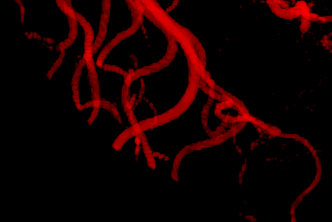
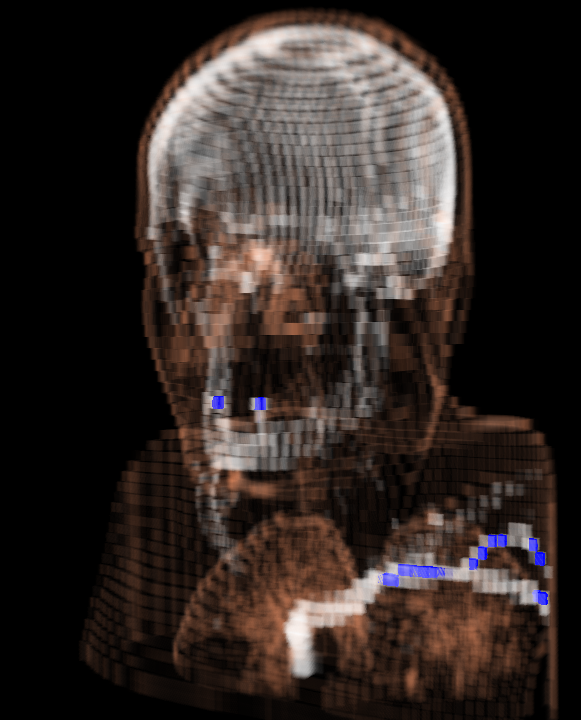
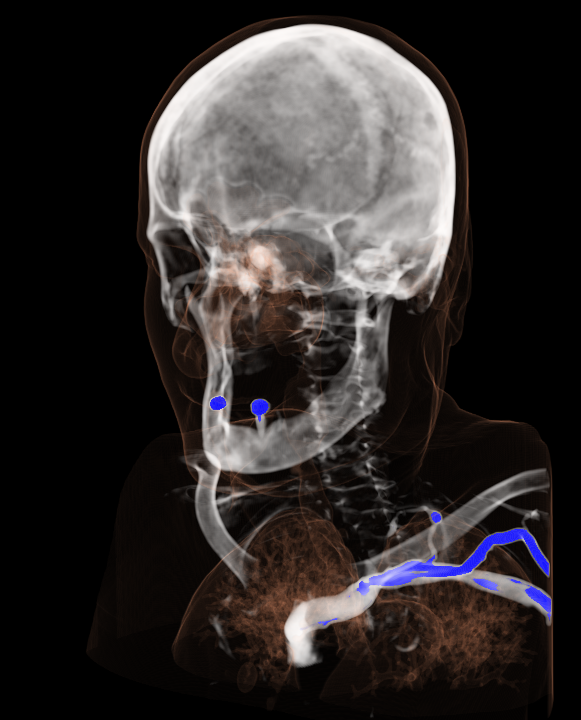
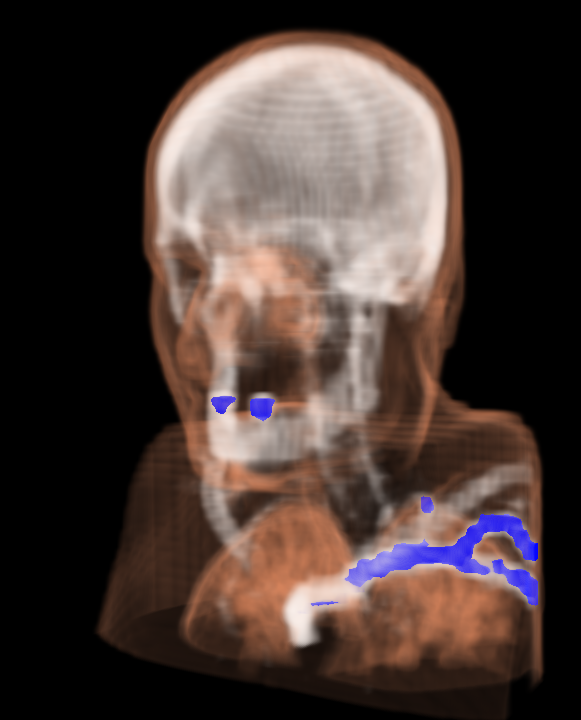
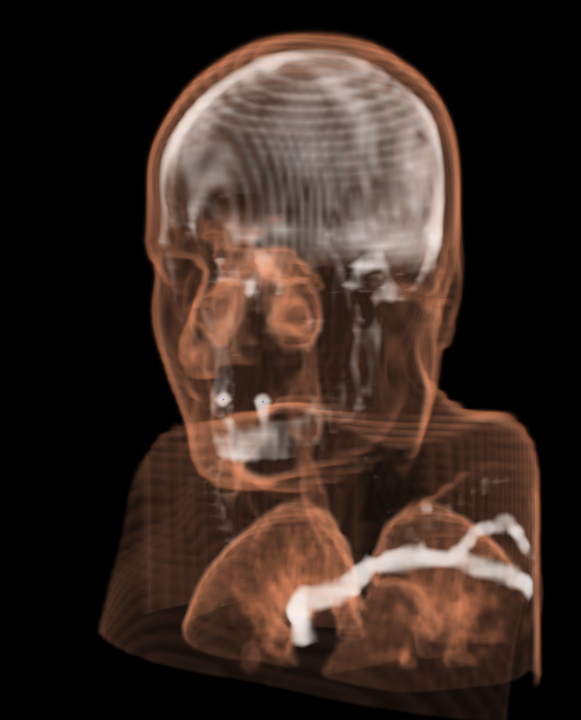
Many large scale volume visualization techniques are based on partitioning the data into bricks, which are stored and rendered using mipmaps. To generate such mipmaps, in most cases an averaging is applied, such that an area in a lower mipmap level is presented by the areas average in the next higher mipmap level. Unfortunately, this averaging results in the fact that mipmaps are not feature-preserving, as details are often lost. In this paper, we discuss and compare mipmap modification schemes which have been developed to support feature-preserving reconstruction during rendering. In particular, we focus on reconstruction schemes which are capable to support anisotropic and non-linear reconstruction, as these are promising to preserve features that are often sacrificed by averaging. The presented techniques are discussed in detail and are thoroughly compared in a quantitative and qualitative analysis. We will discuss their impact on performance, memory footprint and visual quality with respect to feature preservation. Based on the made findings we present guidelines for generating and using mipmaps in various visualization scenarios.
BibTeX
@article{maisch2016mipmaps,
	title={A Comparative Study of Mipmapping Techniques for Interactive Volume Visualization},
	author={Maisch, Sebastian and Skanberg, Robin and Ropinski, Timo},
	year={2016},
	journal={Journal of WSCG},
	volume={24},
	pages={35--42},
	issue={2}
}
Figures