Where did my Lines go? Visualizing Missing Data in Parallel Coordinates
Computer Graphics Forum (Proc. of EuroVis) 2022
* authors contributed equally
Abstract
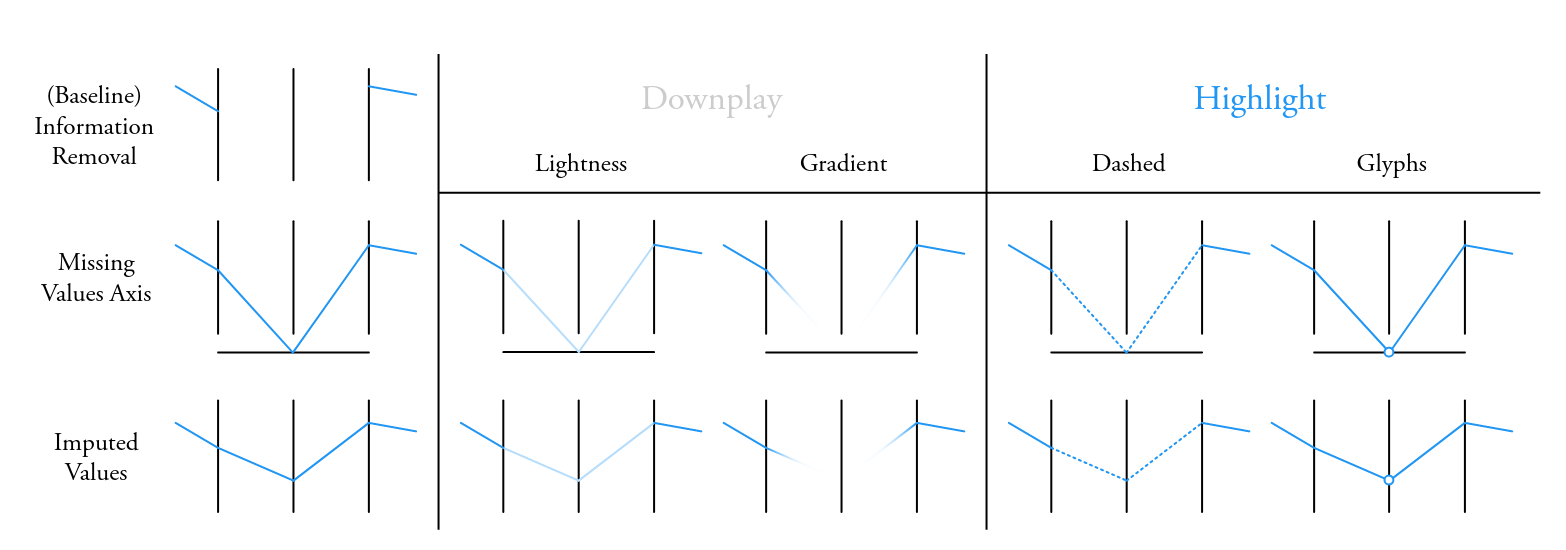
We evaluate visualization concepts to represent missing values in parallel coordinates. We focus on the trade-off between the ability to perceive missing values and the concept’s impact on common tasks. For this purpose, we identified three missing value representation concepts: removing line segments where values are missing, adding a separate, horizontal axis onto which missing values are projected, and using imputed values as a replacement for missing values. For the missing values axis and imputed values concepts, we additionally add downplay and highlight variations. We performed a crowd-sourced, quantitative user study with 732 participants comparing the concepts and their variations using five real-world datasets. Based on our findings, we provide suggestions regarding which visual encoding to employ depending on the task at focus.
BibTeX
@article{baeuerle2020where,
	title={Where did my Lines go? Visualizing Missing Data in Parallel Coordinates},
	author={B{\"a}uerle, Alex and van Onzenoodt, Christian and der Kinderen, Simon and Johansson Westberg, Jimmy and J{\"o}nsson, Daniel and Ropinski, Timo},
	year={2022},
	journal={Computer Graphics Forum (Proc. of EuroVis (2022))},
	volume={41},
	issue={3},
	doi={10.1111/cgf.14536}
}