On the Perceptual Influence of Shape Overlap on Data-Comparison Using Scatterplots
Computers & Graphics 2020
Abstract
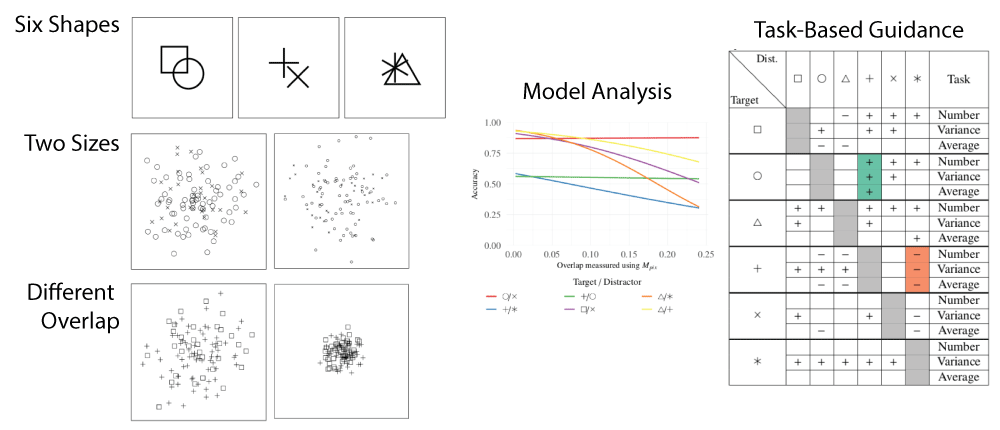
Scatterplots can be used for a wide range of visual analysis tasks, for example comparing correlations or variances of clusters across potentially multiple classes of data, in order to find answers to higher-level questions. Comparing classes of data in one scatterplot demands additional visual channels to encode this dimension. While perception research suggests colors as rather perceptually dominant, other studies show that shapes can also be visually salient. However, with an increasing amount of data, overlapping shapes can cause perceptual difficulties and obscure data. Even though shapes in scatterplots have been investigated extensively, the overlap between these shapes has usually been avoided by using synthetic scatterplots. To overcome this limitation, we investigate the perceptual implications of overlap when comparing data using scatterplots using a series of crowd-sourced user studies. These studies include common visual analysis tasks, like comparing the number of points, comparing mean values, and determine the set of points that is more clustered. To support our investigations, we introduced and compared four metrics for overlap in scatterplots. Our results provide insight into the overlap in scatterplots, recommend combinations of shapes that are less prone to overlap, and outline how our metrics could be used to optimize future scatterplot design.
BibTeX
@article{vanOnzenoodt20influence,
	title={On the Perceptual Influence of Shape Overlap on Data-Comparison Using Scatterplots},
	author={van Onzenoodt, Christian and Huckauf, Anke and Ropinski, Timo},
	year={2020},
	journal={Computers & Graphics},
	volume={90},
	pages={169--181},
	issue={5},
	doi={10.1016/j.cag.2020.05.028}
}